
Uber Deep Dive part 2
Breaking down Uber

Dear Partners,
First and foremost: A huge thank you for all the likes and reactions on my previous posts! It’s fantastic to see the analyses resonate so strongly. Your support is a massive motivator to keep learning together.
In this comprehensive Deep Dive, we take a close look at Uber, a company that was for years synonymous with burning venture capital but has since undergone an impressive metamorphosis. I must honestly admit: during the analysis, Uber surprised me in a positive way. The shift from "growth at all costs" to a disciplined, profitable platform giant has happened faster and more powerfully than many thought possible.
Our conclusion on whether we would invest in Uber right now after completing this Deep Dive is clear. After reading this Deep Dive, I am curious to hear your thoughts on Uber. Let me know!
If you want to see more Deep Dives, make sure to subscribe and like this post. Over 100 hours of research go into these deep dives to provide you with these insights.
Casteleyn Partnership
Table of Contents
1. Uber’s History: From Disruptor to Institution
1.1 Birth & Aggressive Disruption (2008 – 2010)
1.2 Hypergrowth and “Grey” Tactics (2011 – 2016)
1.3 Cultural Crisis & Management Pivot (2017)
1.4 The Path to Profitability (2018 – Present)
2. The Platform Business Model
2.1 Building the “Operating System for Everyday Life”
2.2 Orchestrating Supply & Demand
2.3 Monetization: The Three Pillars of Revenue
2.4 Scale and the Path to Profitability
3. Business Model & Operational Metrics
3.1 Gross Bookings vs. Revenue
3.2 The Growth Formula: MAPCs x Trips x Spend
3.3 Segment Analysis: The Three Engines
3.4 Uber Mobility
3.5 Uber Delivery
3.6 Uber One Membership (Mobility & Delivery)
3.7 Advertising Revenue (Mobility & Delivery)
3.8 Uber Freight
4. Competition
4.1 Market Consolidation and the “Frenemy” Strategy
4.2 The Profitability Inflection Point
4.3 Organic vs. Inorganic Growth
4.4 Competitive Landscape by Region
5. Competitive Advantages (The Moat)
5.1 Network Scale & Effects
5.2 Brand: From Name to Verb
5.3 Marketing Efficiency
5.4 Platform & Data: Turning Data into Action
5.5 The “Super App” Strategy & Stickiness
6. Management
6.1 Management Incentives
6.2 Ownership & “Skin in the Game”
6.3 Capital Allocation Strategy
6.4 Autonomous Vehicles Market
6.5 Management Conclusion: Casteleyn Partnership
7. Narrative and Numbers
7.1 Free Cash Flow & Cash Conversion
7.2 Analysis of Uber’s Owner Earnings (2024)
7.3 Capital Expenditure (CapEx)
7.4 Margins
8. Total Addressable Market (TAM)
8.1 Mobility Segment
8.2 Delivery Segment
9. Valuation (Scenario Analysis)
9.1 Take Rates
9.2 Gross Bookings and Revenue
9.3 EBITDA Margins
9.4 EBIT
9.5 Interest
9.6 Tax Considerations and Global Minimum Tax
9.7 Net Income Per Share
9.8 Valuation and Market Multiples (P/E & P/S)
10. Risks
10.1 Driver and Courier Classification
10.2 Intense Competition
10.3 Autonomous Vehicle (AV) Strategy
10.4 Cybersecurity and Data Protection
10.5 Regulatory Restrictions & Climate Transition
10.6 Fiscal Risks and VAT Disputes
10.7 Dependency on Third Parties for Infrastructure
11. Conclusion Casteleyn Partnership

1 Uber’s History: From Disruptor to Institution
To understand Uber’s current market position, we must look at its turbulent history. We can categorize its journey into four crucial phases:
1.1 Birth & Aggressive Disruption (2008 – 2010)
Uber began in 2008 as an exclusive “Black Car” service in San Francisco, born out of frustration with the traditional taxi industry. Under the leadership of co-founder Travis Kalanick, the company developed an ideology of “aggressive disruption”: bypass traditional permits, capture the market first, and handle the legal battles later.
Source: Uber IR
1.2 Hypergrowth and “Grey” Tactics (2011 – 2016)
With the launch of UberX, the company scaled globally. Uber gained market share by outsmarting authorities using controversial software (such as ‘Greyball’) to evade regulators. During this era, the focus was entirely on growth and dominance at any cost.
1.3 Cultural Crisis & Management Pivot (2017)
2017 served as a reckoning. A toxic corporate culture, mounting legal scandals, and the #DeleteUber movement forced the board to take action. Kalanick (Co-founder) was replaced by Dara Khosrowshahi (Currrent CEO), who was tasked with succeeding the “warrior king” and transforming Uber into a mature, public institution.
1.4 The Path to Profitability (2018 – Present)
Under Khosrowshahi, the strategy shifted fundamentally:
Rationalization: Uber sold its costly, loss-making self-driving division (ATG) following a fatal accident in Arizona, pivoting to a platform-based AV strategy.
Diversification: Significant expansion into Uber Eats and Uber Freight created a multi-layered ecosystem.
Regulatory Stability: The company began embracing regulation (such as California’s Prop 22) to secure the status of drivers without dismantling its core business model.
Source: Casteleyn Partnership image
2) The Platform Business Model
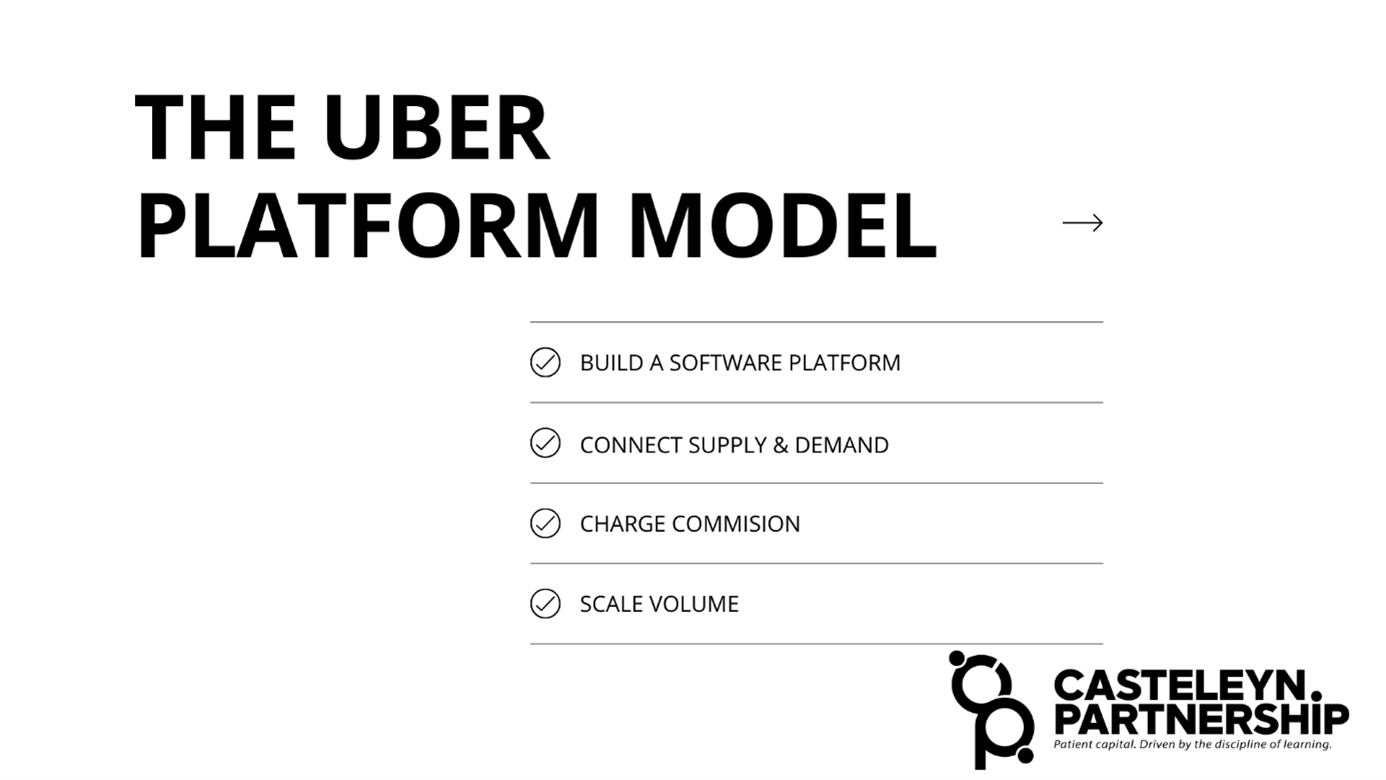
At its core, Uber is a technology platform, not a transportation company. It owns no vehicles and employs no drivers. Instead, Uber acts as a digital “matchmaker,” connecting riders and eaters with independent service providers.
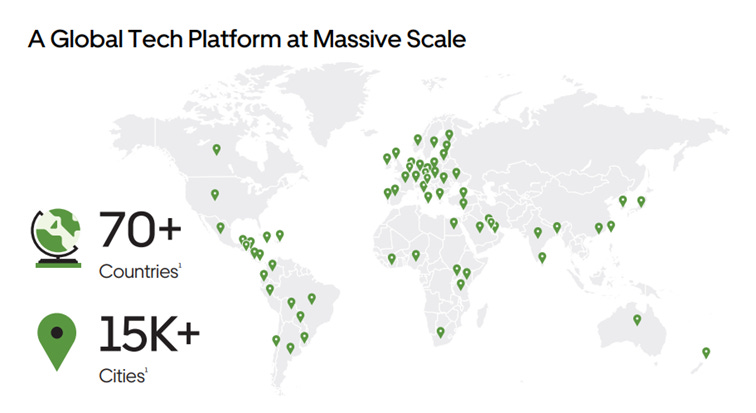
Uber operates globally. It services approximately 15,000 cities worldwide, in more than 70 countries:
Source: Uber IR
Uber operates an asset-light model. For every transaction, Uber collects a service fee (the “take rate”), typically between 20-30%, in exchange for providing the 1) technological infrastructure, 2) payment processing, and 3) marketing.
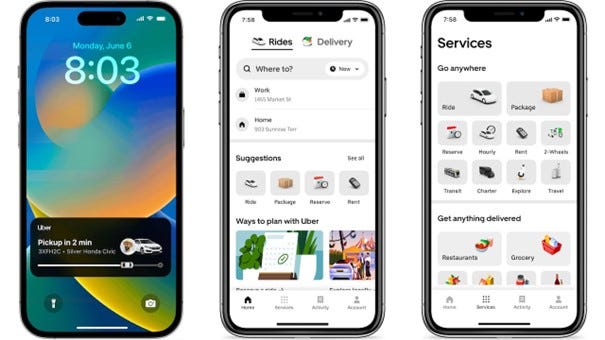
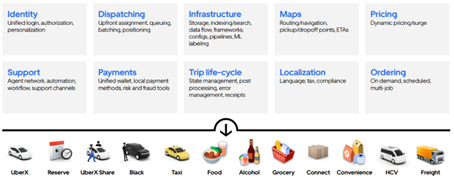
2.1 Building the “Operating System for Everyday Life”
Uber is evolving into a Mobility-as-a-Service (MaaS) platform. The invisible force stabilizing this ecosystem is data-driven infrastructure:
Dynamic Pricing (Surge): This algorithm functions as a real-time market clearing mechanism. By increasing prices during peak demand, Uber rebalances the market by incentivizing drivers to move to high-traffic areas without direct corporate mandates.
MaaS Integration (Data): Uber’s vision is to become the: “Operating System for your everyday life.” By integrating third-party services like Lime scooters and public transit data, Uber captures a wealth of user behavior data, increasing the “stickiness” of the app.
2.2 Orchestrating Supply & Demand
The Uber marketplace serves three distinct pillars: consumers, providers (drivers/couriers), and business partners (restaurants/retailers).
The Demand Side: Uber utilizes a “Super-App” strategy to lock consumers into its ecosystem. Offering rides, meals, and groceries in a single interface significantly lowers customer acquisition costs (CAC) for new services.
The Supply Side: By shifting capital expenditures (vehicle costs, fuel, maintenance) to the providers (Drivers), Uber maintains a highly scalable cost structure. Uber’s primary “costs” here are the algorithms and marketing incentives required to maintain fleet density.

Source: Uber IR
2.3 Monetization: The Three Pillars of Revenue
Uber extracts value through three reinforcing streams:
Transactional Commission (Take Rate): A digital toll booth that skims a percentage off every trip or delivery. This is pure brokerage margin.
Subscription Model (Uber One): A brilliant retention play. By charging a monthly fee for benefits, Uber leverages the “sunk cost fallacy”—members feel compelled to use Uber more frequently to justify the cost, resulting in higher Lifetime Value (LTV).
High-Margin Advertising: This is Uber’s newest and most profitable layer. By selling “sponsored listings” to restaurants and brands, Uber monetizes consumer intent. Since Uber knows your exact destination and preferences, this ad space is high-intent and highly valuable.
2.4 Scale and the Path to Profitability
Uber has invested billions in its global brand and cloud infrastructure. These are largely fixed costs—the cost of the code does not increase significantly whether it serves one million or one billion rides.
As volume scales, these fixed costs are spread across a much larger number of transactions. This creates operating leverage:
The Turning Point: For years, Uber was loss-making because fixed costs outweighed marginal profits.
2023 Inflection: In 2023, Uber reached a historic milestone by posting its first operational profit. This confirms that the platform has finally achieved the scale necessary to outgrow its overhead.
3) Business Model & Operational Metrics
To analyze Uber effectively, we must look beyond the app and focus on the underlying financial engines. We evaluate Uber through four primary lenses: Gross Bookings, Monthly Active Platform Consumers (MAPCs), Unit Economics (Take Rate), and its Segment Performance.
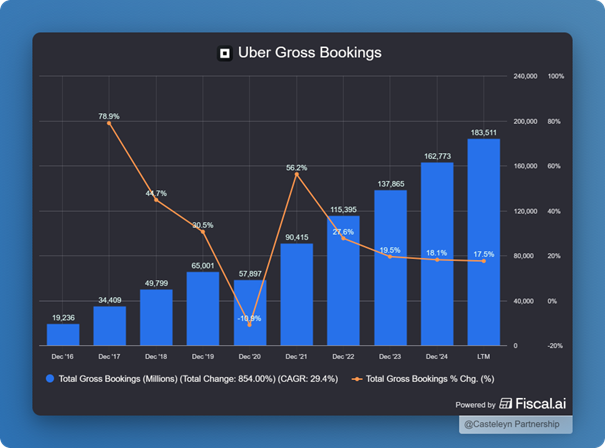
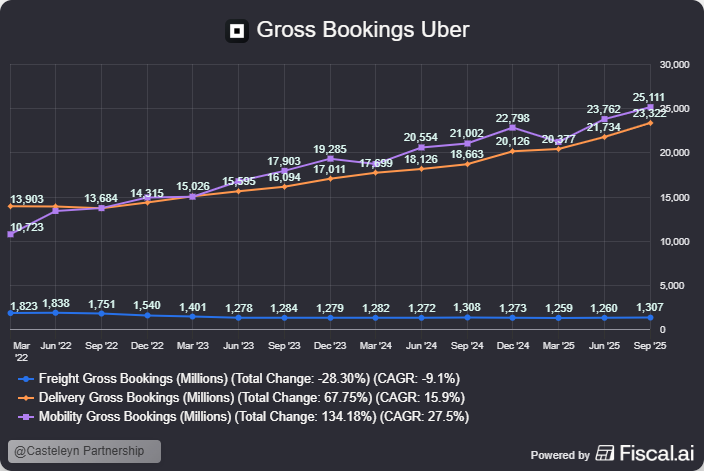
3.1 Gross Bookings vs. Revenue
Gross Bookings represents the total dollar value of all services (including taxes, tolls, and fees) transacted on the platform.
It is vital to distinguish this from Revenue. While Gross Bookings show the total market volume, Revenue is only the portion Uber retains (the Take Rate) after paying out drivers, restaurants, and couriers.
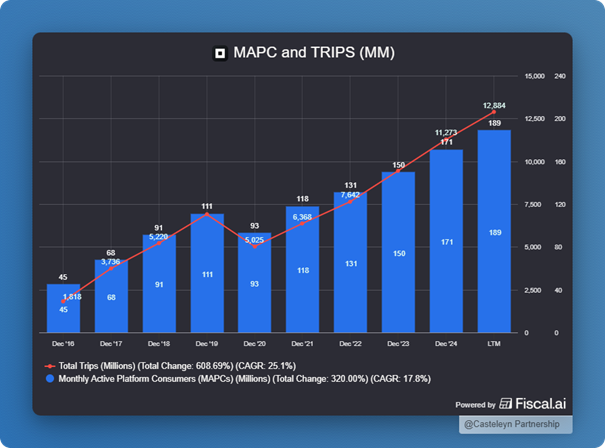
3.2 The Growth Formula: MAPCs x Trips x Spend
As an analyst, I prioritize Monthly Active Platform Consumers (MAPCs) and Trips as leading indicators for Uber.
MAPCs (Reach): Horizontal growth. More unique users = a larger capital pool.
Trips (Frequency): Vertical growth. Increased engagement per user (e.g., from 4 to 6 trips/month) drives efficiency.
Formula: Gross Bookings = MAPCs (The Network) × Trips (The Frequency) × Spend (The Price per Trip).
3.3 Segment Analysis: The Three Engines
To understand the machine behind the app, we must look at the engines driving the company. Although Uber began as a simple ride-hailing mediator, it has evolved into a massive ecosystem extracting billions in value through various channels:
Uber Mobility
Uber Delivery + Advertising
Uber Freight
3.4 Uber Mobility
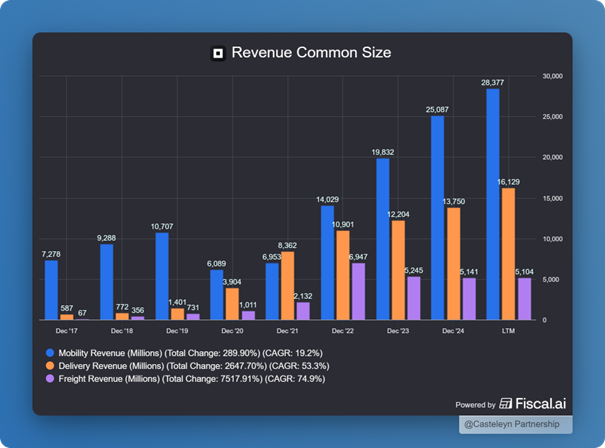
Mobility products connect consumers with drivers providing rides in various vehicles, such as cars, auto-rickshaws, motorbikes, minibuses, or taxis. This segment remains Uber’s largest and most profitable unit. The primary monetization mechanism is the “Take Rate”—Uber retains a percentage of the fare, which for Mobility is around ~30%.
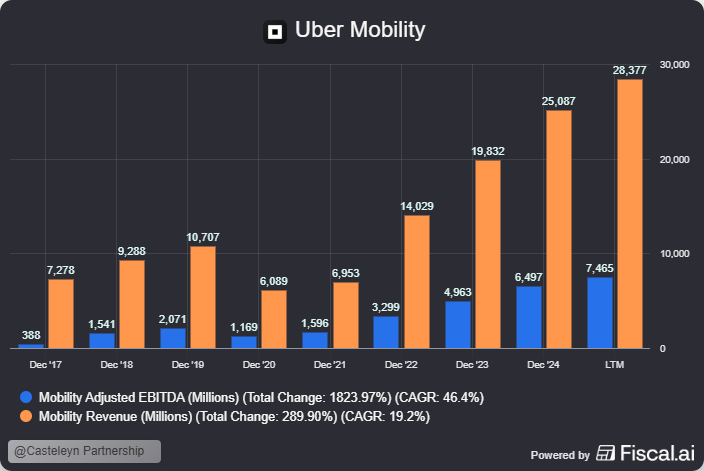
This branch has been profitable since 2017. Over the years, Uber has added numerous use cases. I was personally surprised to see that in London (December 2025), I could even book Uber rides specifically for disabled access. Drivers are the backbone of this service; without these “gig workers,” the platform loses its value proposition for customers.
3.5 Uber Delivery
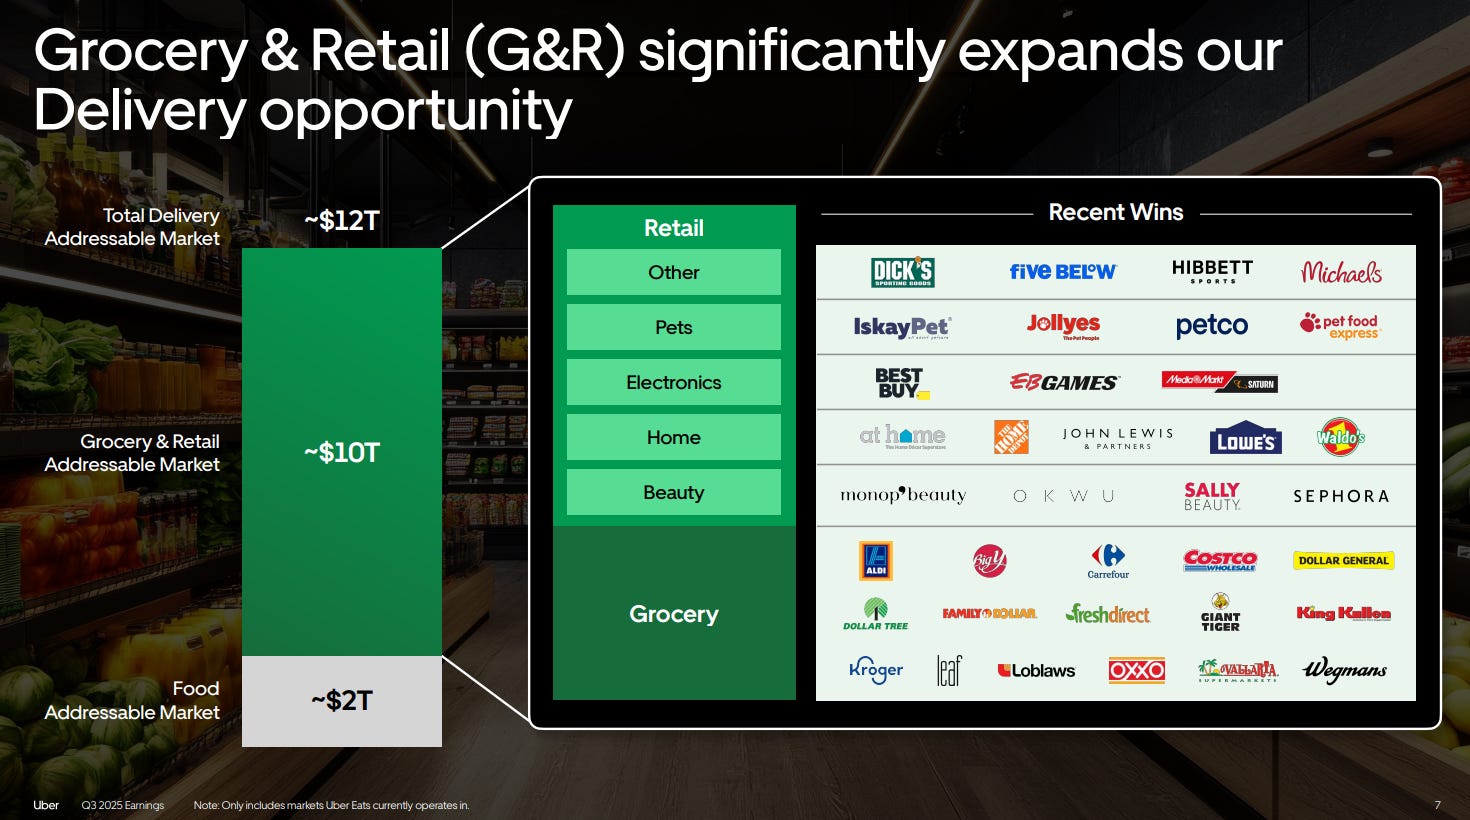
The Delivery segment, primarily under the Uber Eats brand, has evolved into a comprehensive “get anything” logistics platform. Take a look to this picture below:
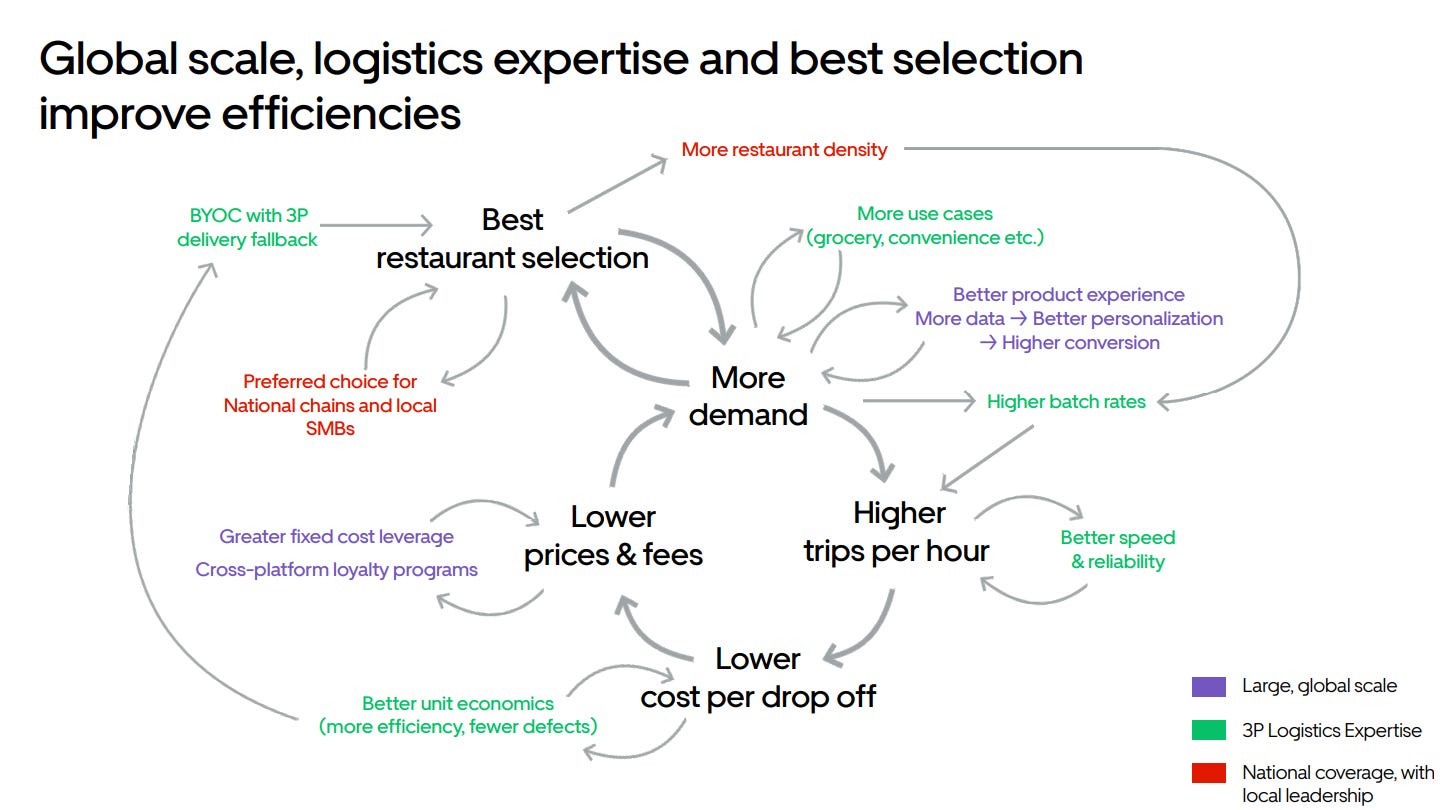
Source: Uber IR
The revenue model is more complex than Mobility, involving a three-way split between the platform, the merchant, and the courier. The Take Rate here is approximately ~19%. Delivery segment is a fast growing business and since 2022 profitable:
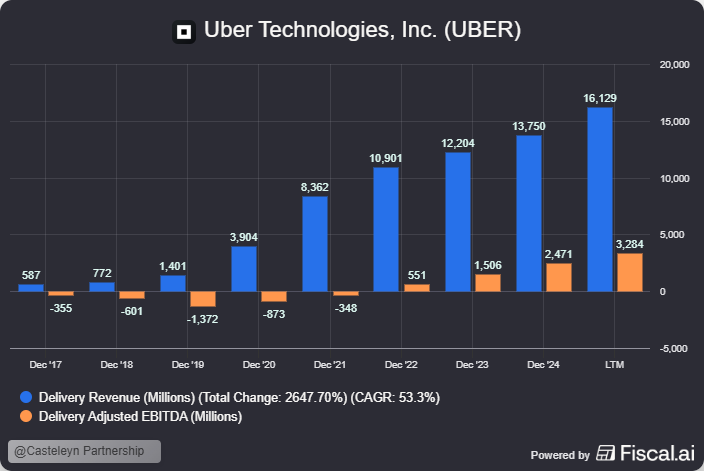
Delivery is growing faster than mobility and also the Gross Booking is nearly the same. Growth is driven by:
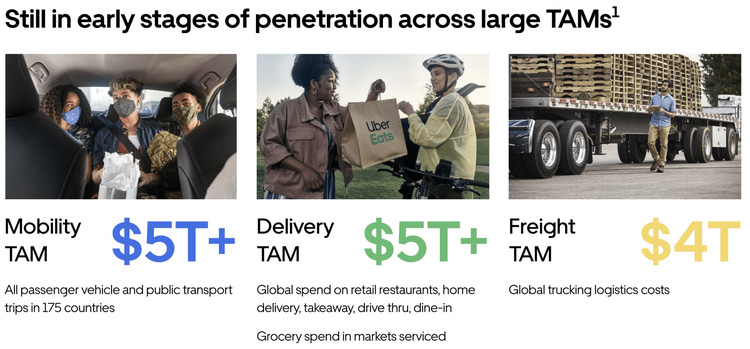
TAM of $12 Trillion dolar.
Active Merchants: By 2024, Uber supported over 1.5 million merchants globally. This includes giants like Aldi, Best Buy, and Petco. In the US alone, active merchants grew by over 10% in 2024.
Uber Direct: A white-label solution for large chains to use Uber’s infrastructure for their own webshop orders.
Grocery & Retail: This is a massive untapped opportunity. The grocery & retail segment has a TAM of $10 Trillion.
Management noted some oppurtunities in Delivery in Q3 2025:
“30% of our mobility riders have never tried Uber Eats, and 75% have never tried grocery and retail.”
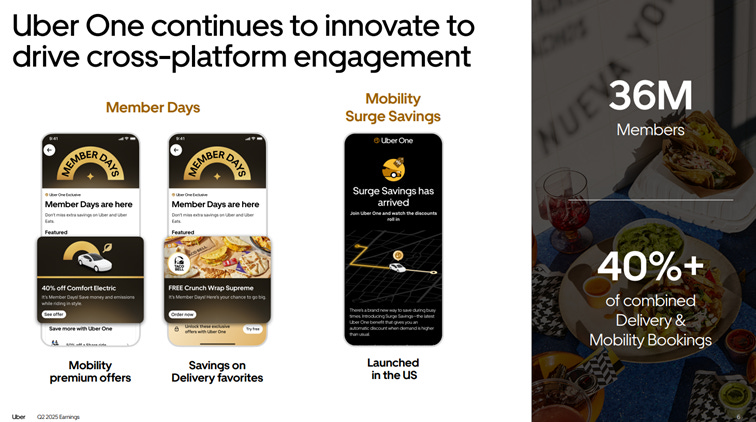
3.6 Uber One Membership (Mobility & Delivery)
Uber is investing heavily in Uber One. Uber One is a cross-platform subscription program that integrates discounted rides and fee-free deliveries into a single ecosystem to drive higher customer retention and lifetime value. Uber One reached over 36 million members by Q2 2025 (60% YoY growth). Members are 3x more valuable than non-members.
The Power of Cross-Selling and Subscription Synergy Uber One, the company’s subscription model, is a masterclass in platform synergy. By locking users into an ecosystem that covers both mobility and delivery, Uber creates a powerful cross-selling engine.
Elevated Retention: A subscriber who uses Uber for both commuting and food delivery has a significantly higher Customer Lifetime Value (CLV) than a single-service user. This multi-service usage creates “stickiness,” making it far less likely for a customer to switch to a competitor.
Marginal CAC is Zero: Once a user is in the Uber One ecosystem, the Customer Acquisition Cost (CAC) for introducing them to a new service—like a Robotaxi—is effectively zero. Uber doesn’t need to buy a new ad; they simply send a notification or offer a member-exclusive autonomous ride.
Efficiency Dividend: This synergy allows Uber to outbid competitors for new users because they know they can recoup the acquisition costs through multiple revenue streams (Rides, Eats, and eventually AVs). For a standalone AV app, every ride must be profitable on its own; for Uber, the profitability is calculated across the entire customer relationship.
As the CEO stated at the 2025 Goldman Sachs conference:
“We have the best membership program in the world... we have more content than any other player because you get discounts on both mobility and delivery.”
Source: Uber IR
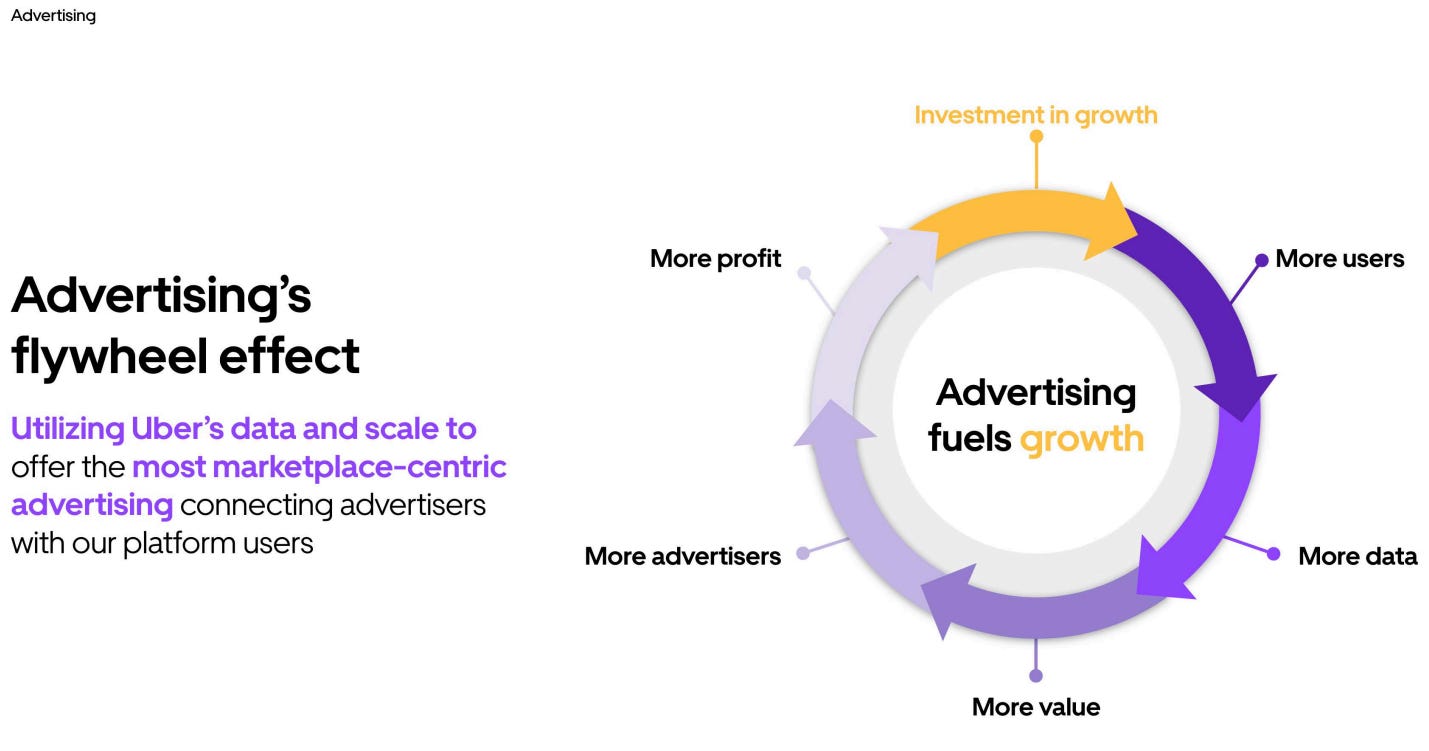
3.7 Advertising Revenue (Mobility & Delivery)
This is one of Uber’s fastest-growing and highest-margin segments, with a 2025 run rate exceeding $1.5 billion (60%+ YoY growth). Compared to $225 million in 2021, the growth is staggering.
‘‘If you think about Uber Eats, there are two pieces of value that Uber Eats brings. There’s audience to an SMB restaurant that it brings, and then there’s fulfillment capability, which is getting the food to the home. We separated those two capabilities into an advertising business that’s growing incredibly healthy, very, very high margin, and a direct business where essentially we deliver on demand for our customers who may have brought those consumers to their front door on their own, through their own app.’’- CEO Q3 2025
Advertising on Uber is attractive to merchants because the platform enables them to reach consumers at the exact moment they are making a purchase decision. Some primary reasons why this is advantageous for them:
High Purchase Mindset: Consumers open the Uber app with a specific goal: to go somewhere or to order something. This means they are already in a “decision-making phase.” Displaying an advertisement at this moment acts as a “pre-purchase nudge” (a push just before the purchase).
Destination-Based Targeting: Unlike other platforms that target based on demographics, Uber can target based on a user’s destination. If someone is traveling to a supermarket or restaurant, there is a high probability that an advertisement for a brand sold there will be relevant.
Proven Return on Investment (ROI): Research shows that U.S. merchants using Uber’s marketing tools achieve an average return on investment (ROI) of 8:1.
Data: Uber controls the entire customer journey, from viewing the advertisement to the final transaction within the app. This allows merchants to see exactly what effect their ad spend has on actual sales, which is often more difficult to measure with traditional advertising.
Captive Audience: During a ride or while waiting for a delivery, users often check their screens to monitor progress. “Journey Ads” (ads during the trip) have an average viewing time of more than 100 seconds, which is much higher than the average attention span on other digital channels.
New Customer Acquisition: Interactive ad formats, such as “Playable Ads,” have proven very effective: in some campaigns, 22.56% of redeemed offers came from customers who had never ordered from that merchant before.
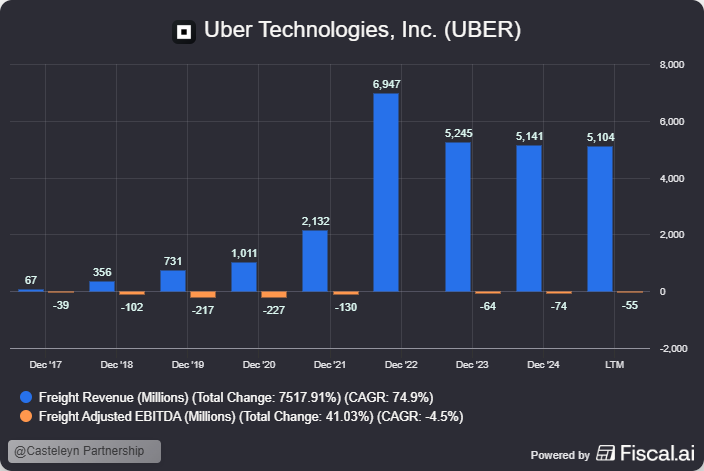
3.8 Uber Freight
The smallest segment ($5.14B revenue), Uber Freight connects carriers with shippers. It uses AI-driven pricing to improve efficiency in a sector often plagued by “empty miles.” The process begins when a shipper posts a load on the Uber Freight platform, which uses real-time pricing and matching algorithms to connect the shipment with an available carrier. The result is a streamlined logistics cycle where the carrier fulfills the delivery with improved fleet utilization while both parties benefit from transparent, automated tracking and payment.
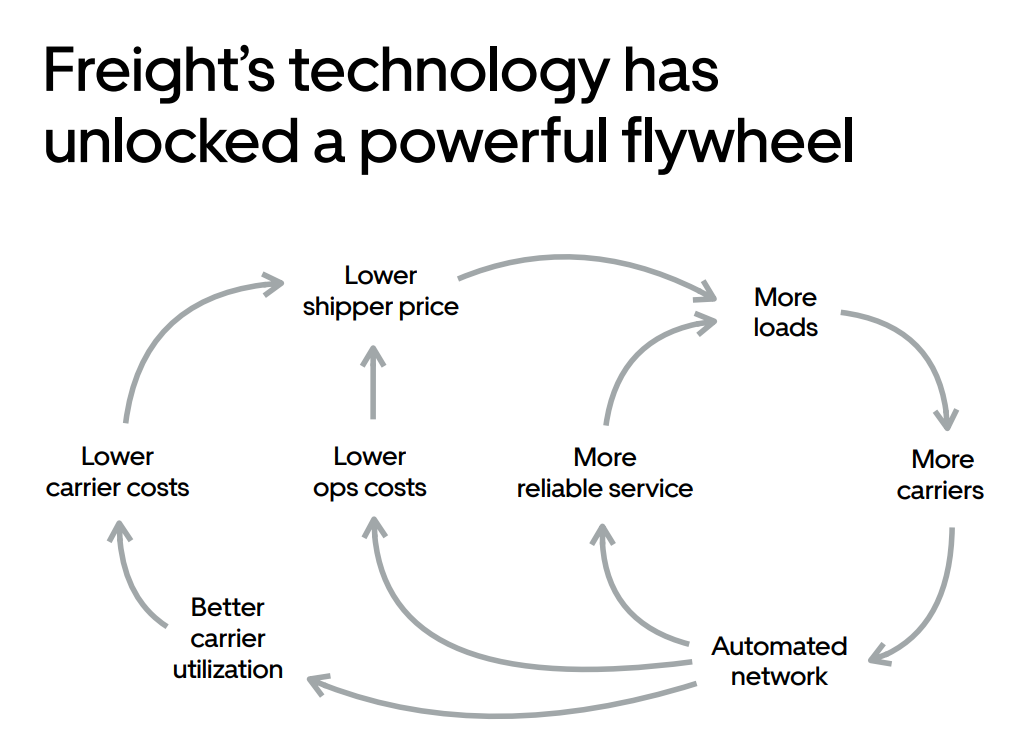
Source: Uber IR
The model is a hybrid of transaction fees and SaaS revenue from its Transportation Management System (TMS). While the market is cyclical, the segment is nearing break-even as it shifts toward these higher-margin software services:
4) Competition
A critical factor for Uber is maintaining its market leadership in every region where it operates. When a company achieves market leadership and profitability at Uber’s scale, it becomes nearly impossible for new entrants to gain a foothold. This leads to market saturation, leaving only a few dominant players to serve the market. While new technologies can disrupt this balance (which we will discuss later), Uber currently operates from a position of strength.
As the CEO noted in Q1 2025:
“In terms of mobility, we’ve got a strong competitor domestically here in Lyft. I think we’re more focused on competing with each other on service, on quality... Internationally, of course, we’ve got Bolt in Europe and DiDi in Latin America. They’re strong competitors... Even in a very competitive market, our category position continues to be market-leading. The same in delivery as well. Obviously, the U.S. market is highly competitive.”
Uber sees significant geographic upside remaining. While Mobility is active in over 70 countries, Delivery is only present in 30, representing a vast untapped opportunity:
‘‘We believe that there are still geographic opportunities for us. For example, mobility is in 70-plus countries. Delivery is only in 30.’’- UBS’s 2025 Global Technology and AI Conference
Our estimates of leadership by Region:
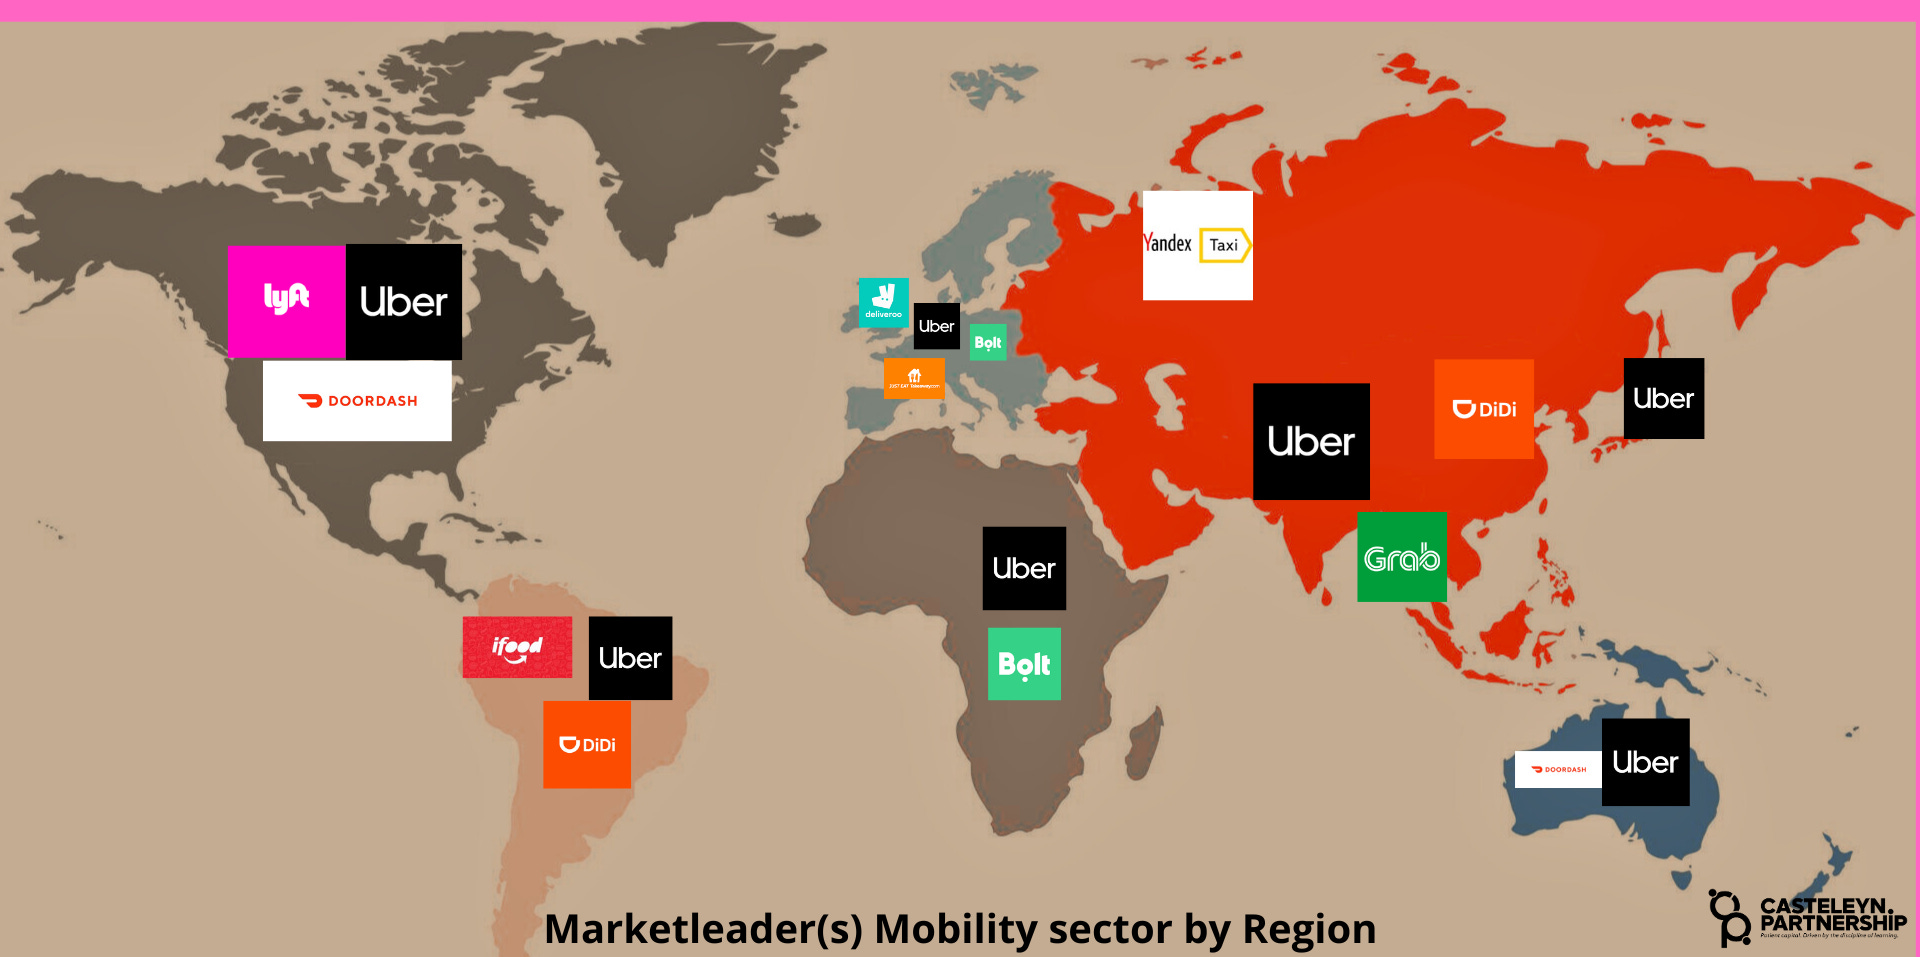
Source: Casteleyn Partnership
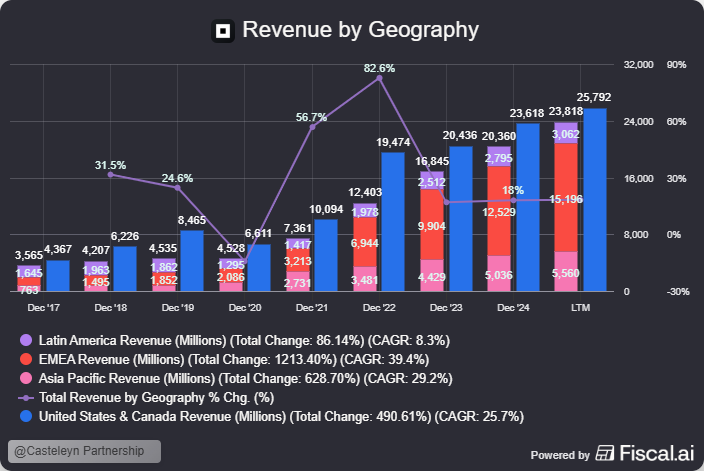
Revenue growth by geograpghy:
4.1 Market Consolidation and the “Frenemy” Strategy
Market consolidation is a vital process in the digital platform economy. It transforms a fragmented market into a stable environment with a few dominant players. In the early growth phase, companies often burn billions in capital through aggressive discounts and driver bonuses to capture market share. Consolidation occurs when competitors merge, are acquired, or exit loss-making regions.
For Uber, this shift was essential to enter the “Mature Growth” phase of its corporate life cycle. In this stage, valuation is driven by the ability to realize healthy margins rather than pure revenue growth. Uber strategically addressed this by selling its loss-making operations in complex markets like China, Southeast Asia, and Russia to local champions in exchange for equity stakes:
China: Uber China was sold to DiDi in exchange for a stake in DiDi.
Southeast Asia: The regional business was sold to Grab in exchange for shares.
Russia: A merger with Yandex.Taxi.
This “frenemy” strategy ended ruinous price wars, allowing Uber to benefit from the regional market growth via its investment portfolio without losing money on daily subsidies.
4.2 The Profitability Inflection Point
This consolidation contributed directly to the “Profitability Inflection Point” seen in Uber’s financials. Since 2023, the operating margin has shifted from deep red to profitable. In a consolidated market, such as the duopoly in mobility with Lyft in the U.S., players no longer need to sell every ride at a loss to squeeze out the competition.
This has resulted in an exceptional cash conversion of 90% (Reported by uber, we will discuss the FCF and cash conversion in chapter 7.1). Because revenue streams are “cleaner” and no longer eroded by heavy promotions, nearly every dollar from daily operations remains as Free Cash Flow (FCF). With a resulting war chest, Uber has the firepower to invest in future initiatives like autonomous vehicles.
4.3 Organic vs. Inorganic Growth
Uber prides itself on growing organically in new markets, whereas competitors often have to buy their way in. As the CEO stated in Q1 2025:
“It’s not a surprise to see some of our competitors look to expand there inorganically. We like organic expansion more. We’ve been investing for years in these marketplaces, and I think it shows in our results.”
4.4 Competitive Landscape by Region
here is a short summary:
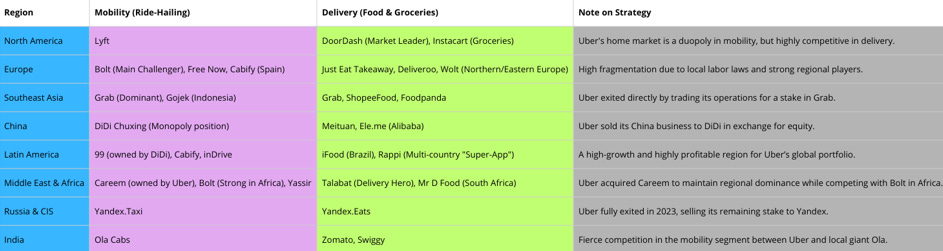
Source: Casteleyn Partnership
In Europe the CEO highlighted the momentum in Q3 2025:
‘’Yeah, absolutely. We are very happy about our position in Europe. We got the leading position in Europe. We have become the number one player in the U.K. We have been the number one player in France for some period of time. We are gaining category position very solidly in both Spain and Germany. I was visiting there last week to visit with the teams and understand a bit more about the market. The momentum in Europe and the profitability in Europe is excellent. Listen, food is a huge category. It is no surprise. This is a $2 trillion TAM in food and kind of $10 trillion TAM in groceries. Competition is going to be a fact. We have built a position in Europe organically, and some of our competitors have had to buy their way into a European position’’- CEO Q3 2025
5.0 Competitive Advantages (The Moat)
Scale Economies Shared is a powerful economic concept at the heart of Uber’s success. It implies that as the company grows, the cost advantages generated by this scale are shared back with the users (consumers, drivers, and couriers) rather than being retained solely as profit. This creates a virtuous cycle that is extremely difficult for competitors to break.
5.1 Network Scale & Effects
Uber’s vast network—comprising tens of millions of drivers, consumers, merchants, and shippers across over 10,000 cities—creates a self-reinforcing ecosystem.
Network Intelligence: Every interaction contributes to smarter operations through data aggregation.
Liquidity: The sheer reach of the network enables rapid scalability and a seamless user experience. As the platform attracts more users, engagement and operational efficiency increase, making the service more valuable for every participant.
5.2 Brand: From Name to Verb
Uber has achieved the rare status of becoming a “verb” (”ordering an Uber” or “ubering”). This level of top-of-mind awareness allows Uber to enter new markets with significantly lower costs.
Trust as a Catalyst: Because consumers already trust the brand for rides, the transition to Uber Eats, grocery delivery (Aldi, Best Buy), and package shipping was seamless and far cheaper than it would be for a new entrant.
Lower CAC: The brand acts as a seal of quality that drastically lowers Customer Acquisition Costs (CAC) for new service lines.
Loyalty via Uber One: In a sector where discount-driven competitors come and go, Uber One builds a predictable, loyal, and high-frequency user base that competitors simply cannot match.
5.3 Marketing Efficiency
A clear indicator of Uber’s moat is its marketing leverage. While absolute dollar spend remained relatively stable between 2021 and 2024 (approx. $4.3B – $4.8B), marketing as a percentage of revenue plummeted from 32% to less than 10%. This proves that Uber is now an “established name” that no longer relies on expensive ads to buy market share. The fact that new customers and trip volume grew significantly despite lower relative spending confirms the organic strength of the brand.
5.4 Platform & Data: Turning Data into Action
The core of Uber’s competitive edge lies in its ability to convert data into operational efficiency:
Advanced Systems: Using sophisticated demand forecasting, dispatching, and dynamic pricing, Uber manages its marketplace with an efficiency unreachable for smaller rivals.
Maximizing Occupancy: Continuous investments in AI and data analytics allow Uber to proactively optimize routes and maximize the utilization rate of drivers and couriers.
Scalability: The integration of marketplace and routing systems allows Uber to scale effortlessly from Mobility and Delivery into complex logistics like Uber Freight.
5.5 The “Super App” Strategy & Stickiness
By uniting various services into one seamless experience, Uber has moved beyond being a single-service app.
Customer Stickiness: Membership programs like Uber One (36 million members as of Q2 2025) create a powerful “lock-in” effect. Members exhibit significantly higher retention rates.
Cross-Platform Synergies: Offering rides, delivery, and groceries in one interface lowers the friction for customers to try new services. This not only drives customer satisfaction but also significantly increases the average engagement (and lifetime value) per user.
Soure: Uber IR
6.0 Management
Dara Khosrowshahi (Chief Executive Officer): Since taking the helm in 2017, Khosrowshahi has navigated Uber through turbulent waters by refocusing the company on cultural transformation and profitability.
Dara Khosrowshahi: The Leader Who Scaled Expedia and Rescued Uber: Before taking the helm at Uber in 2017, Dara Khosrowshahi built a reputation as one of the most disciplined and effective CEOs in the travel industry. His transformation of Expedia remains a benchmark for scaling digital marketplaces.
The Expedia Transformation (2005–2017)
During his 12-year tenure, Khosrowshahi turned a Microsoft spinoff into a global travel powerhouse. The business improved significantly under every core metric:
Financial Growth: Revenue surged from $2.1 billion to $10.1 billion. Total travel bookings quadrupled, and pre-tax earnings more than doubled.
Aggressive M&A: He executed 41 deals totaling $12.7 billion, acquiring major competitors like Travelocity, Orbitz, and HomeAway.
Mobile Pivot: He aggressively shifted resources toward mobile technology, which eventually accounted for over half of Expedia’s traffic.
Culture: Unlike the “tech bro” culture often found in Silicon Valley, Khosrowshahi was known for a calm, employee-centric approach, earning him top ratings on Glassdoor.
A Regretted Departure: Expedia was notably reluctant to see him leave. Chairman Barry Diller expressed “great regret” over the exit, though he gave Dara his blessing for the “next adventure.” Investors shared this sentiment; Expedia’s stock price dropped approximately 4% immediately following the news of his potential move to Uber.
Why Uber Chose Him: In 2017, Uber was hemorrhaging cash and mired in scandal. The board selected Khosrowshahi over finalists like Meg Whitman (HP) because he offered a specific “antidote” to their crisis:
Proven Profitability: He had already proven he could make a high-volume internet transaction platform profitable—the primary challenge Uber was facing.
“Order to Chaos”: His “no-drama,” disciplined leadership style was the direct opposite of founder Travis Kalanick’s brash and controversial approach.
Diplomatic Acumen: Dara was viewed as a leader who could make peace with global regulators and handle the massive litigation Uber faced, including trade-secret disputes with Waymo.
He has transformed Uber into a global powerhouse for mobility, delivery, and freight across more than 70 countries. Despite years of negative headlines, he has turned Uber into a “best-in-class” operator. At 55, he likely has many years ahead as CEO, with his next primary objective being the successful transition to an autonomous future.
Prashanth Mahendra-Rajah (Chief Financial Officer): Mr. Mahendra-Rajah joined Uber in November 2023. He brings a wealth of experience from senior financial roles at Analog Devices, WABCO, Visa, and United Technologies. He currently serves on the board of Shopify and previously served on the board of Goodyear. While his tenure at Uber is relatively short, he has already been instrumental in driving operational discipline and expanding margins. In our opinion the CFO has had to little time to prove himself.
Jill Hazelbaker (Chief Marketing Officer & SVP, Public Affairs): Since 2019, Ms. Hazelbaker has led Uber’s marketing and public policy efforts. With previous senior roles at Snap and Google, and a background in high-level political communications (including Senator John McCain’s presidential campaign), she is responsible for the brand’s global reputation and the strategic messaging that supports Uber’s regulatory efforts. This role is strategically very important for Uber and she has proven that she is the right person for this role over the years.
6.1 Management Incentives
The Board of Directors has established a compensation structure designed to align management with specific strategic goals.
Key Incentive Pillars:
Uber One Dominance: Driving the membership program to become the primary engine for high-frequency use.
Autonomous Future: Incentivizing executives to make Uber the “partner of choice” for AV companies worldwide. As the Board stated in 2024:
“We believe AVs can unlock tremendous value for Uber... our AV strategy incentivizes our executives to become the top partner for AV companies worldwide.”
Sustainability & ESG: Goals for a zero-emission platform by 2030 (major cities) and 2040 (globally).
Free Cash Flow (FCF): A shift in focus from “Adjusted EBITDA” to actual cash generation, enabling capital returns to shareholders via buybacks.
Long-term Performance Share Units (PRSU) Cycle 2024-2026: The payout in March 2027 is determined by a weighting of 80% financial goals and 20% strategic goals:
Adjusted EBITDA Margin (40%): Measured annually against targets.
Gross Bookings Growth (40%): Three-year average growth.
Electrification & Safety (20%): Reducing emissions and lowering serious safety incidents.
6.2 Ownership & “Skin in the Game”
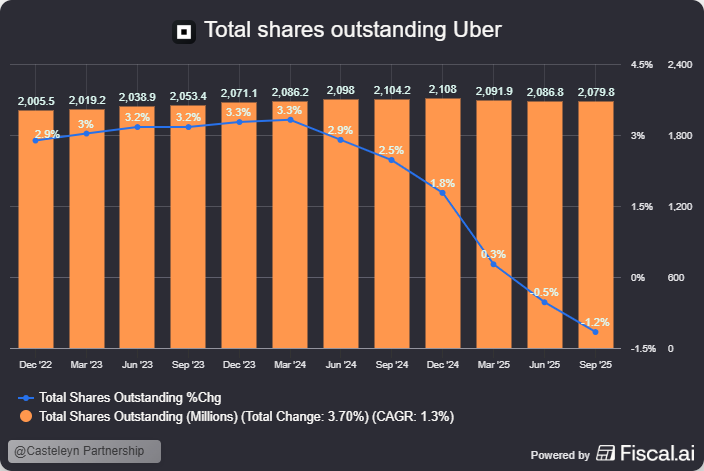
Uber maintains rigorous stock ownership guidelines. The CEO is required to hold shares valued at ten times his base salary. Collectively, the management and Board of Directors hold approximately 3.70% of all outstanding shares, ensuring a level of alignment with the investment community.
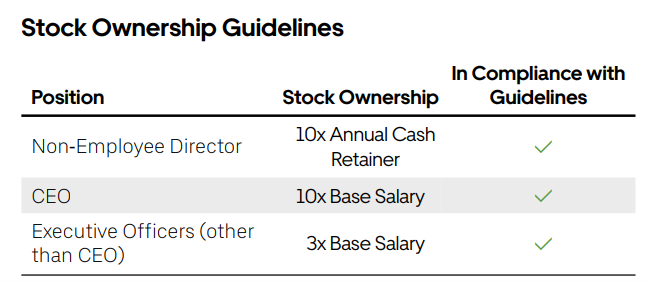
Source: Uber IR
6.3 Capital Allocation Strategy
Following a period of aggressive expansion, Uber has pivoted toward sustainable profitability. According to Aswath Damodaran’s corporate life cycle model, Uber has entered the ‘Mature Growth’ phase. In this stage, management’s primary objective is to scale operations through enhanced operational leverage while directing investments into future growth vectors.
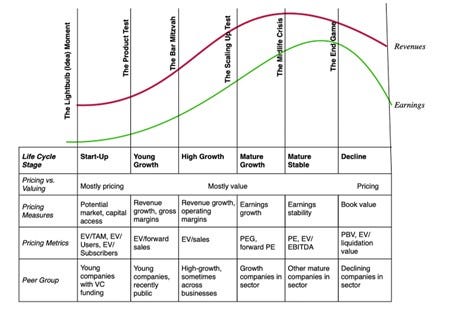
Source: Corporate life cycle Aswath Damodaran
Share Repurchases (Buybacks): Uber has experienced rapid growth, and to secure the necessary talent and capital, they had to issue a significant number of shares (SBC). To achieve market leadership on the scale that Uber has, substantial investments were requiredAs Uber has reached consistent profitability, the Board has authorized massive share buyback programs to offset previous dilution and return value to shareholders. This includes an initial $7.0 billion authorization in early 2024 and an additional $20.0 billion authorized in July 2025.
Strategic Stake Management (Capital Recycling): Uber treats its stakes in other companies not as permanent assets, but as a source of capital to be “recycled” into buybacks or core investments.
Zomato: Uber exited its ~10% stake in 2022 for $376 million, following its exit from the Indian food delivery market.
Aurora Innovation: Uber sold its self-driving unit (ATG) to Aurora in exchange for a ~26% stake. This allows Uber to benefit from AV breakthroughs without burning ~$500 million annually in R&D. In May 2025, Uber issued $1.15 billion in exchangeable notes, allowing it to raise cash today using its Aurora shares as collateral.
Grab & DiDi: Resulting from the exits in Southeast Asia and China, Uber holds stakes of approximately 13.5% in Grab and 9.8% in DiDi. Management has stated they intend to “monetize these stakes intelligently over time” to fund buybacks.
Yandex: Uber fully exited its Russian joint venture in 2021 for $1 billion, eliminating geopolitical risk from its balance sheet.
6.4 Autonomy vehicles market
This part was covered in the first part of this Deep Dive. you can read it here.
6.5 Management conclusion Casteleyn Partnership
The core of my confidence in Uber’s future lies in the execution power of the current management team. As long as Uber succeeds in keeping crucial partners—from hardware giants to software pioneers—bound to its platform, there is a high probability they will emerge as the victor from this transformation. However, Uber is currently in a transition phase where the business model could be at risk if not managed correctly. The incentive structure established by the Board of Directors is primarily focused on this transition to Autonomous Vehicles (AVs) and the expansion of Uber One. For us, “skin in the game” is a vital metric, and in our opinion, the management and Board hold a sufficient stake to align their interests with shareholders.
While Mobility is the flagship, Uber Delivery represents nearly 50% of all Gross Bookings. It is therefore crucial that management mitigates the risks within Mobility by continuing to grow the Delivery segment and improving its profit margins. This is an aspect often overlooked by investors. Through the subscription model (Uber One), advertising, and cross-platform synergies, margins in this segment could exceed expectations. Furthermore, as this branch grows, the benefits of scale will only intensify. Management’s success will ultimately be judged by their ability to scale both pillars of the platform simultaneously.
With CEO Dara Khosrowshahi, Uber has a leader who has proven his ability over the past few years to rehabilitate Uber’s reputation and solidify its position as the world’s largest player. He has instilled a corporate culture that is truly impressive. Furthermore, during his tenure at Expedia (2005–2017), Dara demonstrated that he can be aggressive when necessary, yet he carries himself as a calm and thoughtful leader.
Uber has entered a new stage of its corporate life cycle: the Mature Growth phase. In this stage, management’s primary objective is to scale operations through enhanced operational leverage while directing investments into future growth vectors. Additionally, creating shareholder value is paramount. While Uber is doing this through an extensive share buyback program, it must be noted that Stock-Based Compensation (SBC) remains very high. This high level of SBC is a significant hurdle for us; management must demonstrate that they can reduce these costs while continuing to attract top-tier talent.
In our view, management acted wisely by exiting certain markets over the last few years. Utilizing their equity stakes in companies like Grab and DiDi for other investments and buybacks is, in our opinion, the optimal strategy for Uber. We believe Uber should only remain active in a market if:
They hold a (partial) market leadership position.
They can challenge the competition sufficiently to prevent rivals from encroaching on Uber’s core markets.
Grow organically.
All in all, the management team is showing positive results. However, to truly endorse a company, we must monitor management over a longer period, as we believe management remains the most critical link in creating long-term shareholder value. For the upcoming years we will follow the results of the company.
7.0 Narrative and Numbers
Uber’s balance sheet is robust. Thanks to a significant increase in profitability (Adjusted EBITDA), the leverage ratio (Debt/EBITDA) fell to 1.3x in 2024. While total debt in absolute terms rose slightly to $12.19 billion, its growth (a CAGR of 3.3%) is negligible compared to the growth in cash reserves. Furthermore, Uber is proactively deleveraging; the company repaid $2.0 billion in outstanding debt in Q4 2024 and has scheduled a $1.2 billion repayment of convertible bonds for Q4 2025.
7.1 Free Cash Flow & Cash Conversion
While Uber has been FCF-positive since 2023, it is vital for our analysis to deduct the high Share-Based Compensation (SBC), for the following reasons:
Equity Dilution: Although SBC is a non-cash expense, it creates new shares. This dilutes your ownership percentage, representing a real economic cost to the shareholder.
Masking Labor Costs: SBC is an alternative to cash salaries. If a company stops issuing shares, it must pay more in cash to retain talent. Subtracting SBC reveals the true operational profitability of the business model.
Protecting Returns Per Share: Ultimately, investment value is driven by cash flow per share. By treating SBC as a real expense, we avoid overvaluing the company while our stake in the cash flow potentially stagnates due to dilution.
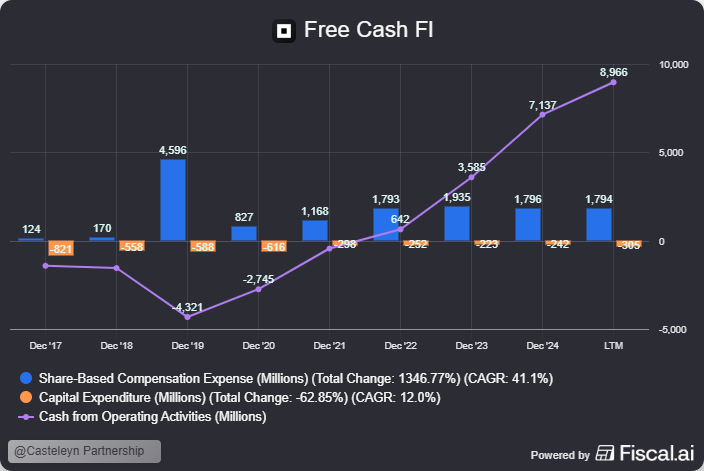
Uber’s Operational Cash Flow – CapEx – SBC Analysis:
Dec ‘22: Operating cash flow was positive for the first time at $642 million. However, after deducting CapEx ($252M) and high SBC costs ($1,793M), the net result was a negative free cash flow of -$1,403 million.
Dec ‘23: Operating cash flow grew to $3,585 million. Despite investments of $223 million and SBC of $1,935 million, the company became truly FCF-positive for the first time, reaching $1,427 million. The cash flow conversion rate stood at 40%.
Dec ‘24 (The Acceleration): Operating cash flow nearly doubled to $7,137 million. With CapEx ($242M) and SBC ($1,796M) remaining relatively stable, free cash flow surged to $5,099 million. The conversion rate improved substantially to 71%.
LTM (Last 12 Months - Current Status): The positive trend continues with an operating cash flow of $8,966 million. After CapEx ($305M) and SBC ($1,794M), an impressive free cash flow of $6,867 million remains.
Resulting in a cash conversion of 77%.
A high cash conversion rate is one of the most important barometers of a company’s quality:
Efficient Growth (Asset-Light): It proves the company requires minimal capital expenditure (like factories or heavy machinery) to grow. Cash can be directed toward expansion rather than just maintenance.
Reliable Earnings: It confirms that “paper profit” actually arrives as cash in the bank, ensuring customers are paying and capital isn’t trapped in unsold inventory.
Financial Independence: The company is not dependent on banks or secondary share offerings, making it far more resilient to economic headwinds.
Shareholder Value: High conversion leaves more room for buybacks, dividends, or strategic acquisitions.
A cash conversion rate approaching 90% (Uber reporting) is an exceptionally strong indicator of operational efficiency. For Uber, this means nearly every dollar generated from daily operations (Cash from Operating Activities) is available as Free Cash Flow for shareholder returns or strategic investments.
As management stated in Q2 2025:
“If you look at our history now, we’ve been allocating around 50% of our free cash flow to buybacks. I think that’s a fair sort of way for you to think about how we will execute the capital return over the coming years... You should expect this to be sort of a multi-year plan.”
7.2 Analysis of Uber’s Owner Earnings (2024)
To determine the True Owner Earnings, further adjustments are required for items that artificially influenced the 2024 cash flow. The most significant correction concerns the insurance reserves, which increased by $2,819 million in 2024. This represents capital that Uber receives today but must pay out for future claims; because this is a temporary “float” rather than structural profit, we deduct this amount in full. Additionally, we deduct the $172 million in lease principal repayments. Although these are recorded as financing activities under IFRS 16, they are, in practice, essential operational expenses for maintaining office space and the fleet.
Finally, we adjust for the $607 million in interest paid and a small amount of capitalized R&D costs totaling $12 million. There is also a massive correction visible for deferred taxes amounting to $6,027 million. This item pertains to a non-cash tax benefit (a so-called tax valuation allowance release) that inflated net income but had no impact on actual cash. Since the operational cash flow of $7,137 million has already been adjusted for this “paper” gain, this amount does not need to be deducted again to reach the final owner earnings.
Calculation of Owner Earnings 2024:
Net cash provided by operating activities: $7,137 million
— Stock-Based Compensation (SBC): ($1,796 million)
— Maintenance CapEx: ($242 million)
— Principal payments on finance leases: ($172 million)
— Capitalized R&D: ($12 million)
— Cash paid for interest: ($607 million)
— Normalization of Accrued insurance reserves: ($2,819 million)
Normalized Owner Earnings 2024: $1,489 million
By accounting for all these structural and one-off factors, we arrive at normalized Owner Earnings of approximately $1,489 million for 2024.
7.3 Capital Expenditure (CapEx)
Uber’s CapEx is expected to grow in the coming years, driven by its transition from a pure software marketplace to an integrated mobility ecosystem. Investments in hardware, data infrastructure, and fleet management are essential to reap the benefits of Level 4 Autonomy.
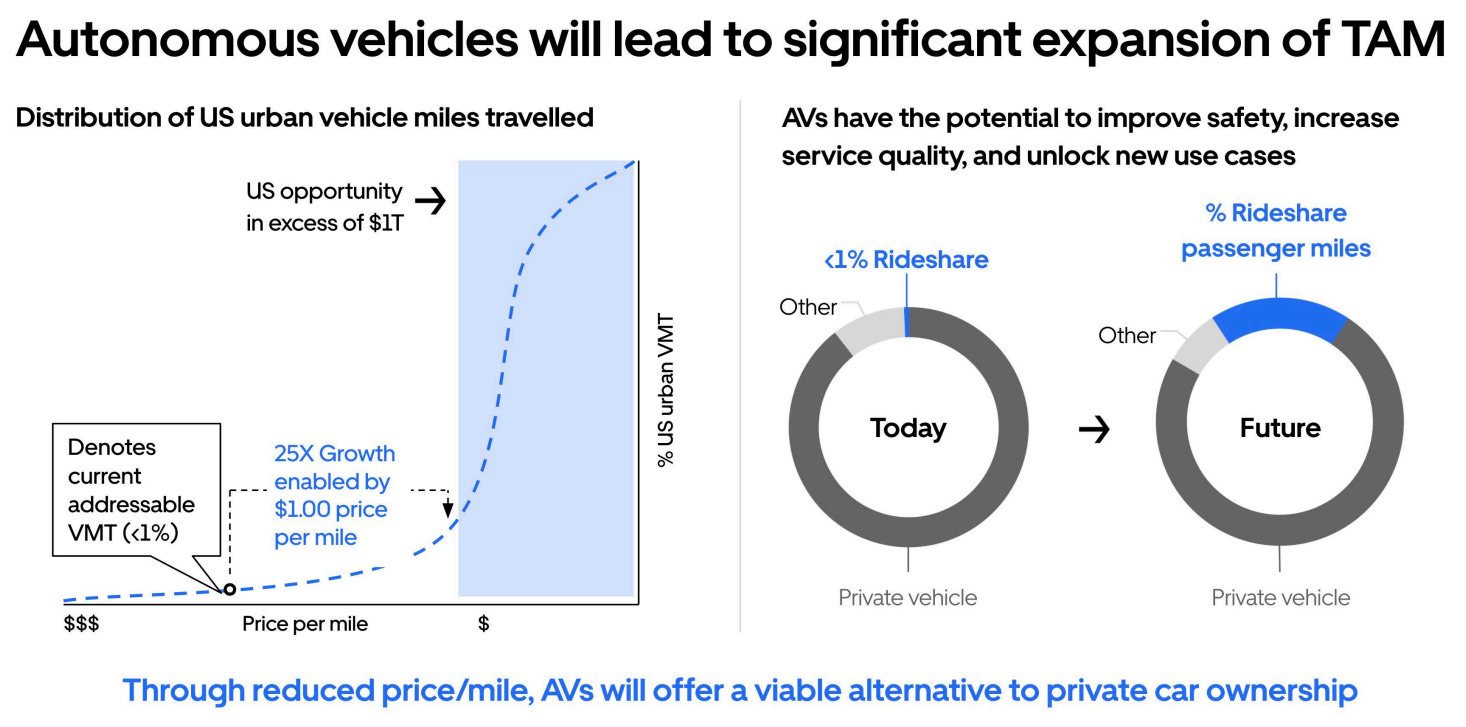
While this shift will lead to short-term margin pressure on the P&L and a more complex cash conversion cycle, the long-term promise is one of exponential revenue growth and profitability. By replacing the driver—the platform’s largest variable cost—with scalable technology, Uber can reduce the cost per mile below the threshold of private car ownership.
7.4 Margins
The projected increase in EBITDA margins in chapter 9 (Valuation) is underpinned by several strategic and operational levers that transform Uber’s underlying unit economics:
Scale and Operational Excellence: As Uber reaches greater scale, fixed costs are distributed over a larger volume of Gross Bookings. Operational excellence, driven by process automation and AI-driven optimizations, significantly reduces non-value-add tasks and administrative overhead.
High Advertising Margins: Advertising revenue across the Mobility and Delivery segments carries near-100% margins.
Lower Customer Acquisition Costs (CAC): The Uber One loyalty program creates a powerful “flywheel” effect, where members spend significantly more than non-members. This organic retention reduces the need for aggressive marketing spend.
Platform Synergies: By integrating Mobility, Delivery into a single “Super-App,” Uber leverages its technology and data across multiple markets. These economies of scope allow for higher resource utilization—such as couriers switching between food delivery and rides during peak hours—reducing per-order costs.
Higher Spend Per User: Increased engagement frequency through the platform’s multi-service identity drives higher average revenue per user (ARPU).
Smaller, Efficient Workforce: Leveraging a more disciplined financial policy and lean organizational structure allows the company to scale its top line without a proportional increase in headcount or employee-related expenses.
The rate at which we’re investing is we’re launching hundreds of new cities in 2025. There is plenty of room for us to run here. Obviously, there is an investment period before they achieve those more continuity-level margin profiles, but that’s all part of the growth opportunities that we see in front of us.
8 Total adressable market (TAM)
It is difficult to determine the exact TAM (Total Addressable Market) within these segments due to the wide variety of conflicting reports available.
(Source: IR Uber)
For reference, a 2019 industry report by Goldman Sachs covering these three segments can be found here:
(https://www.goldmansachs.com/pdfs/insights/pages/gs-research/future-of-mobility/report.pdf)
Growth in the ride-hailing and delivery sectors is driven by a combination of key structural factors:
Urbanization: As more people migrate to cities, private car ownership is steadily declining. Ride-hailing is increasingly filling the gap in urban mobility.
Technological Innovation: The advent of autonomous driving is a game-changer. Once the driver is removed from the equation, prices for consumers will drop drastically, making ride-hailing cheaper than owning a private vehicle for a large portion of the population.
The Rise of Super-Apps: Companies like Uber and Grab leverage their transportation networks to offer a broader suite of services, including meal delivery, groceries, and financial services. By integrating these services into a single ecosystem (supported by programs like Uber One), they increase customer retention and lifetime value.
Market Penetration: In regions such as Southeast Asia, Africa, and Latin America, only a small fraction of the population currently has access to these apps. Given that public transport is often limited in these markets, ride-hailing is becoming an essential component of the daily infrastructure.
looking at our top 10 markets, only 10% of the adult population uses Uber on a monthly basis. We continue to see great opportunity to continue to penetrate the TAM. And if we look at our top 10 countries in terms of gross booking size, the number of adults in those countries who use either Uber or rides or delivery is around 15%. And then you have the other 60 countries where that penetration is even lower. So on average for the top 10, we’re at 15%. And then if you look within a given country, the number of folks who are using Uber and Uber Eats together is only at 20%. So when we think about over the next several years, why do we remain confident that there are years of growth in front of us? Prashanth Mahendra-Rajah: We know from looking at some of our stronger or more penetrated countries, there’s room to grow that 15%. So that’s going to continue to tick up, and then we’ve seen that trend very steady across our largest markets. You look at the long tail of countries that are not in the 10 largest markets, and those still have to get to the 15%. So still plenty of room to grow there. And then you look at the opportunity to get more folks using both products and grow that 20%.- UBS’s 2025 Global Technology and AI Conference
8.1 Mobility segment
The estimated TAM (Total Addressable Market) for the ride-hailing industry in the US is projected to reach approximately $290 billion by 2034, up from $75 billion in 2025. This represents a compounded annual growth rate (CAGR) of roughly 16%.
The global TAM for Mobility is projected around $5 Trillion. However, the integration of autonomous vehicles (AVs) expands this horizon in the US significantly. As Uber’s CEO noted at the 2025 Goldman Sachs Technology Conference:
“The fourth big growth area for us is AV... It’s a $1 trillion-plus TAM that’s being released for us.”
(Source: IR Uber)
8.2 Delivery segment
The revenue from the Delivery segment is our primary focus and a major driver of the company’s success. As established, this segment generates positive EBITDA with healthy margins that are set to improve further as scale and network effects intensify.
Exceptional Growth: Gross Bookings in this segment are currently growing at over 20% year-over-year (YoY).
Scale of Operations: Annual Gross Bookings for Delivery are projected to reach approximately $100 billion this year.
Market Opportunity: The combined Total Addressable Market (TAM) for grocery, retail, and food delivery is estimated at a staggering $12 trillion.
Uber is effectively transforming from a food delivery app into a broader local commerce infrastructure. By leveraging its existing network, Uber is capturing a larger share of this massive $12 trillion market, particularly through the rapid expansion into Grocery and Retail, which is now growing faster than core restaurant delivery.
(Source: IR Uber)
9 Valuation (Narrative and Numbers)
For the valuation of Uber, we utilize a scenario analysis. Given the immense potential of autonomous vehicles (AVs) and the inherent scalability of the platform, a single price target calculation is insufficient to capture the full spectrum of future possibilities.
9.1 Take rates
Despite market consolidation, new technologies are bringing in fresh competition with deep pockets. We expect Mobility take rates to decrease to 25% rather than rise. Uber will likely have to offer lower prices per mile to stay competitive, which will compress the take rate. On the positive side, this should drive an increase in Gross Bookings, assuming Uber maintains its dominant position in Mobility.
For Delivery, the take rate could potentially rise to 20%. While this remains an incredible growth market for Uber, competition is fierce. To expand margins here, Uber will need to leverage advertising and platform synergies to the fullest.
9.2 Gross bookings and Revenue
The growth of Uber’s gross bookings will rely on these four pillars:
Increasing penetration in existing ride-hailing and online food delivery markets.
Geographical expansion, tapping into new regions with untapped demand.
Acquiring new users via Uber New Mobility offerings (e.g., car rentals).
Reducing churn by leveraging loyalty programs and rewards.
To determine Uber’s future valuation, we have modeled the transition from Gross Bookings to Revenue across three core segments, based on our 5-year CAGR and target Take Rate assumptions.
Mobility
‘‘We expect that uber Mobility gross bookings will grow the upcoming 5 years in a CAGR range between 14-16%. Take rate of Mobility to ~25%’’.
We anticipate that Mobility will remain the cornerstone of Uber’s ecosystem. Despite a projected compression in the Take Rate to 25.0% due to competitive pricing and market maturity, the sheer volume growth compensates for lower margins per mile.
At the lower end (14% CAGR): Gross Bookings will reach $153.6 billion, resulting in a segment revenue of $38.4 billion.
At the upper end (16% CAGR): Gross Bookings will climb to $167.6 billion, generating a segment revenue of $41.9 billion.
Delivery
‘‘We expect that uber Delivery gross bookings will grow the upcoming 5 years in a CAGR range between 16-18%. Take rate of Delivery to ~20%’’.
The Delivery segment represents Uber’s most aggressive growth engine. By leveraging advertising and platform synergies, we expect the Take Rate to expand to 20.0%, significantly boosting the segment’s contribution to the top line.
At the lower end (16% CAGR): Gross Bookings are projected at $154.7 billion, translating to a revenue of $30.9 billion.
At the upper end (18% CAGR): Gross Bookings could reach $168.5 billion, leading to a revenue of $33.7 billion.
Freight
‘‘We expect that uber Freight gross bookings will grow the upcoming 5 years in a CAGR range around 7%’’.
The Freight business serves as a strategic logistics arm. While we expect modest growth and a primary focus on reaching a break-even point, it provides essential scale to the overall network.
At the lower end (4% CAGR): Revenue is expected to grow to $6.2 billion.
At the upper end (8% CAGR): Revenue is projected to reach $7.5 billion.
Total Projected Revenue (2029) Based on these assumptions, Uber’s total consolidated revenue in five years is expected to fall within a range of $75.6 billion (lower-bound) to $83.1 billion (upper-bound). This trajectory highlights a shift toward a more diversified and high-volume revenue mix, underpinned by the increasing dominance of the Delivery ecosystem and the continued scale of the Mobility network.
9.3 EBITDA margins
Based on our projections for Gross Bookings and the specified target EBITDA margins, here is the 5-year EBITDA outlook for 2029. Note that these calculations follow the industry standard of measuring margin as a percentage of Gross Bookings.
Mobility: EBITDA margins are projected to grow from 7.8% to 10.0% of Gross Bookings.
Delivery: This segment will see the most dramatic improvement, with EBITDA margins rising from 3.6% to 5.9%.
Freight: We anticipate a successful turnaround for Freight, with margins moving from (1.7)% to 1.0%.
1. Lower End Scenario
Total Gross Bookings: $314.555 million
Total Adjusted EBITDA: $22,019 million
weighted average EBITDA margin: 7,0%
2. Higher End Scenario
Total Gross Bookings: $343.605 million
Total Adjusted EBITDA: $26.777 million
weighted average EBITDA margin: 7,79%
9.4 EBIT
To arrive at the EBIT, we adjust our projected EBITDA by subtracting Depreciation and Amortization. As noted in section 7.4 we expect CapEx will rise, so we anticipate D&A to increase from approximately 2% to 3.0% of total revenue over the next five years, reflecting higher CapEx requirements for technological infrastructure and fleet management.
We assume that D&A costs are around 3% in 2029.
9.5 Interest
EBIT (2024):
+ Interest income ($721M): The interest Uber receives on its cash balances.
- Interest expense ($607M): The interest Uber pays on its outstanding debt.
= Net Interest Result (+$114M): In 2024, Uber was effectively a “net interest receiver”. The income generated from its cash reserves exceeded the interest costs of its debt obligations.
We assume a good balance between interest costs and income in the coming years, so we keep this at 0% in 2029.
9.6 Tax Considerations and Global Minimum Tax
Uber’s tax profile in the 2024 annual report is heavily influenced by historical losses and shifting international regulations. While the company uses the U.S. statutory rate of 21% as its baseline, the reported net income for 2024 was significantly distorted by a one-time non-cash accounting benefit of $6.0 billion. This “valuation allowance release” occurred because Uber now expects to finally realize its accumulated tax benefits from past years.
Furthermore, Uber is preparing for the OECD Pillar Two regulations, which mandate a global minimum tax rate of 15%. Although the impact was considered insignificant in 2024, Uber warns that this could increase its tax burden in the future as more jurisdictions implement these rules. For the immediate future, Uber still holds $18.8 billion in federal Net Operating Losses (NOLs), which will likely keep its actual cash tax payments in the U.S. relatively low for the time being. After 2029 the tax rate will be higher.
We assume a tax rate of 15% for 2029.
9.7 Net Income per share
1. Lower-End Scenario (Conservative Growth)
Revenue: $75.600 million
EBITDA: $22,019 million.
Depreciation & Amortization (3% of Revenue): — ($2,268 million).
EBIT (Operating Income): $22,286 million.
Interest Income/Costs (0%): -.
EBT (Earnings Before Taxes): $19,752 million
Net Income (15% Tax): $16,789 million
2. Higher-End Scenario (Optimistic Growth)
Revenue: $83.100 million
EBITDA: $26,777 million.
Depreciation & Amortization (3% of Revenue): — ($2,493 million).
EBIT (Operating Income): $24,284 million.
Interest Income/Costs (0%): -.
EBT (Earnings Before Taxes): $24,284 million.
Net Income (15% Tax): $20,641 million
In Chapter 6.3: Capital Allocation Strategy, we discussed the management’s capital allocation priorities. This strategy is primarily focused on share buybacks. We expect the number of outstanding shares to decrease by 2.5% annually until 2029.
Share Count Projection (2029)
To calculate the number of shares in 2029, we apply a compound annual reduction of 2.5% over the 5-year period (2025-2029) to the 2024 baseline.
Diluted Weighted Average Outstanding shares (2024): 2,150,500
Annual Reduction Rate: - 2.5%
Diluted Weighted Average Outstanding shares (2029): 1,894,801
Earnings Per Share (EPS) (2029)
1. Lower-End Scenario (7% EBITDA Margin)
Net Income: $16,789,000,000
Shares Outstanding: 1,894,801,000
Earnings Per Share (EPS): $8.86
2. Higher-End Scenario (Segment-Specific Margins)
Net Income: $20,641,000,000
Shares Outstanding: 1,894,801,000
Earnings Per Share (EPS): $10.89
9.8 Valuation and Market Multiples
We apply a multiple range of 15x, 20x, and 25x earnings and 2x, 3x, and 4x sales. This wide range reflects the inherent difficulty in predicting the long-term evolution of Uber’s business model. A critical pivot point for this valuation is the transition to Autonomous Vehicles (AVs). If the Mobility segment fails to successfully navigate the AV transition, the market is likely to penalize Uber with a significantly lower multiple.
Such a failure could trigger negative platform synergies and declining gross bookings, as competitors with superior autonomous technology could undercut Uber’s pricing and service quality. In a worst-case scenario, this could have a destabilizing effect on the entire ecosystem.
The Lower-End Scenario Earnings
Earnings Per Share (EPS) of $8.86.
A 15x multiple results in a share price of $132.90.
A 20x multiple, results in a share price of $177.20.
A 25x multiple, results in a share price of $221.50.
The Higher-End Scenario Earnings
Earnings Per Share (EPS) of $10.89.
A 15x multiple results in a share price of $163.35.
A 20x multiple, results in a share price of $217.80.
A 25x multiple, results in a share price of $272.25.
The Lower-End Scenario Sales
Revenue Per Share of $39.88.
A 2x multiple results in a share price of $79.76.
A 3x multiple results in a share price of $119.64.
A 4x multiple results in a share price of $159.52.
The Higher-End Scenario Sales
Revenue Per Share of $43.86.
A 2x multiple results in a share price of $87.72.
A 3x multiple results in a share price of $131.58.
A 4x multiple results in a share price of $175.44.
Calculation Notes p/s: The Revenue Per Share is calculated by dividing the total revenue ($75.6 billion for Low and $83.1 billion for High) by the projected number of outstanding shares of 1,894,801,000.
10.0 Risks
The risks described by Uber in their 10-K report are outlined below. For me, the greatest risk is how Uber maintains its position in times of technological innovation, where major players like Alphabet and Amazon with deep pockets enter the markets. Some questions on our side to determine how stong Uber’s platform is:
How much investment will be required to keep up or stay ahead?
Can Uber remain the lowest-cost provider?
Will customers stay loyal to the platform?
Will any owner earnings remain when the company has to make substantial investments?
Is management good enough to lead this transition?
Is the Delivery segment still attractive to customers if the Mobility segment is no longer attractive?
10.1 Driver and Courier Classification
A mandatory reclassification of independent contractors as employees would result in massive additional costs for minimum wages, social contributions, and expense reimbursements. This would force Uber to increase prices, which could directly reduce consumer demand.
10.2 Intense Competition
The mobility and delivery markets have low switching costs, allowing consumers and drivers to quickly switch to the cheapest or highest-paying provider. This forces Uber to make continuous investments in discounts and incentives, putting pressure on profit margins.
10.3 Autonomous Vehicle (AV) Strategy
Uber relies on partners like Waymo and other players for self-driving technology, which poses a strategic risk if these partners operate their own networks independently of Uber. If competitors roll out a safe AV network faster, Uber will lose its position as an aggregator of human drivers.
10.4 Cybersecurity and Data Protection
As a digital platform, Uber is a primary target for cyberattacks on sensitive user data, such as payment details and locations. A serious data breach could lead to massive fines under the GDPR (up to 4% of annual revenue) and irreparable reputational damage.
10.5 Regulatory Restrictions in Key Markets
In cities such as New York, London, and Barcelona, strict rules apply to fares, licenses, and waiting times. Changes in local legislation could force Uber to adjust its business model or even cease operations entirely.
Climate Change and the Transition to Electric Driving The ambition to be emission-free by 2030 depends on the willingness of drivers to invest in expensive electric vehicles. Failure to meet legal environmental targets could lead to the loss of licenses in markets such as California.
10.6 Fiscal Risks and VAT Disputes
Uber is involved in major tax disputes, such as with the British HMRC regarding the application of VAT, where billions of dollars are at stake. The “pay-to-play” system forces Uber to pay disputed amounts in advance, which places a heavy burden on liquid assets.
10.7 Dependency on Third Parties for Infrastructure
Uber does not own its own internet or mapping infrastructure and is critically dependent on Google Maps, AWS, and app stores. Changes in terms or disruptions at these parties could immediately disable the functionality of the Uber app worldwide.
11 Conclusion Casteleyn Partnership
For us, investing is more than a strategy—it is a passion. It is the thrill of the deep-dive analysis and the patience to stay the course when others panic. We focus on the long-term compounders, the companies that act as the engine for your wealth. Our goal is simple: to start the snowball rolling and, more importantly, to have the unwavering discipline to let it grow. So the question is:
Is Uber a longe-term compounder in our eyes?
We focus on Quality Growth. We do not look for companies that happen to be worth slightly more tomorrow, but for the ‘compounders’ of the future. We prefer companies where the founder is still in charge or where management holds a significant portion of their own net worth in shares. Their interests must run parallel to ours. This is the case for Uber. Additionally, management comes across as having high integrity and in our eyes, management has more and more to prove as true capital allocators. However, as stated in 6.5 Management Conclusion: Casteleyn Partnership, we have been following the company for too short a period to draw definitive conclusions about management. We want to be able to evaluate management over a longer period of time, but at first glance, it looks positive.
Uber has an economic moat. Uber has a very strong brand and the flywheel of scale economies shared. This is supported by their platform, which is used daily by millions of people worldwide, and Uber offers them a service that is valuable to them. The larger Uber becomes, the more valuable it becomes for the customer, and with the option to choose between mobility & delivery, the offering for customers only gets better. With Uber One, Uber builds customer loyalty that strengthens their moat. Additionally, Uber has the name, infrastructure, balance sheet, and cash flows to become the organic market leader in (almost) every market. In markets where it could not become the market leader, they acted wisely by stopping their operations and swapping them for equity stakes. For new players, it is impossible to grow organically when Uber and a competitor (Duopoly) are active in the country. Uber has one of the highest margins in the industry, and this gives them an edge over the competition. But does Uber still have this edge when players such as Amazon, Alphabet, and Tesla start to enter their markets?
Uber has a business model that has proven it can grow at attractive returns on invested capital. This Deep Dive has shown that this growth path is certainly not over yet and that they can continue to grow for a very long time. The most important risk is, however, technological innovations, whereby management must steer the transition to AV for Uber in the right direction. Additionally, Delivery will also face several innovations and competition from other angles in the coming years, but we like this segment the most. Uber’s brand is crucial in conjunction with the number of customers.
Some KPIs to keep an eye on are therefore (3.2):
MAPCs (Reach): Horizontal growth. More unique users = a larger capital pool. Trips (Frequency): Vertical growth. Increased engagement per user (e.g., from 4 to 6 trips/month) drives efficiency.
In this Deep Dive, we have not discussed the current share price. This is something I want to avoid psychologically, as it can still influence decisions. But you can conclude that uncertainty is priced into the price. This naturally has a cause that I just described, which is technological innovations. Personally, I cannot predict the future, as I said in Uber Deep Dive part 1:
‘’As the author of this analysis, I do not pretend to possess a crystal ball; after all, the technological and regulatory world of AVs changes faster than the ink on this report can dry’‘.
This is enough reason for Casteleyn Partnership to say ‘’no’‘ for now, and we decide not to become a partner. To become a Partner, we will have to follow the company for a longer period, and we will not be guided by the current ‘’cheap price’‘ which could become a bad bargain in the future. But then again, without risk, there is no return. It is quite possible that we will take a Library card position, which ensures that we keep an eye on Uber.
"We don't have to be smarter than the rest. We have to be more disciplined than the rest."-Warren Buffet
Thank you for reading!
Kevin Casteleijn

Disclaimer: This analysis is provided for informational and educational purposes only and should not be construed as financial, investment, or legal advice. I am not a financial advisor. All investments involve risk, and past performance is no guarantee of future results. Please conduct your own research or consult a certified professional before making any investment decisions based on the content of this deep dive.
Really thorough piece on Uber's shift to profitability. The SBC adjustment as a real econimic cost doesn't get enough attention tbh. That 77% cash conversion metric shows the platform is genuinely maturing. From following a few marketplace models myself, the AV integration timing feels more binary than gradual, making it tricky to size positions even at discounted valuations.